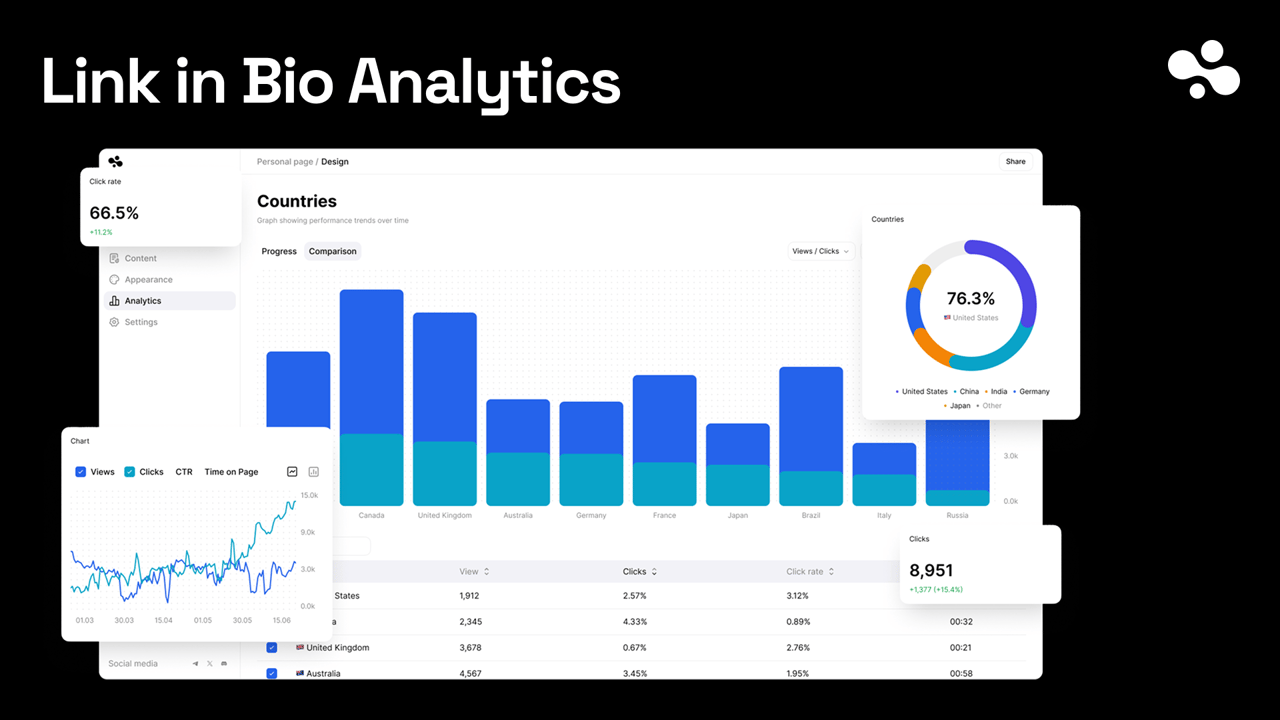
Link-in-bio analytics come down to three numbers: click rate by source, top links, and sales by source. The first says which platform sends people who tap, the second what goes first on the page, the third who pays. A link-in-bio page can report all three because the page is yours; a plain link only forwards (see what a link in bio is). Nothing to install.
Why views are not on the list
Views count arrivals. None of the three decisions changes because 2,000 people arrived instead of 1,000; they change when arrivals tap and buy. Countries and devices matter the day you translate the page or fix an Android layout, not before.
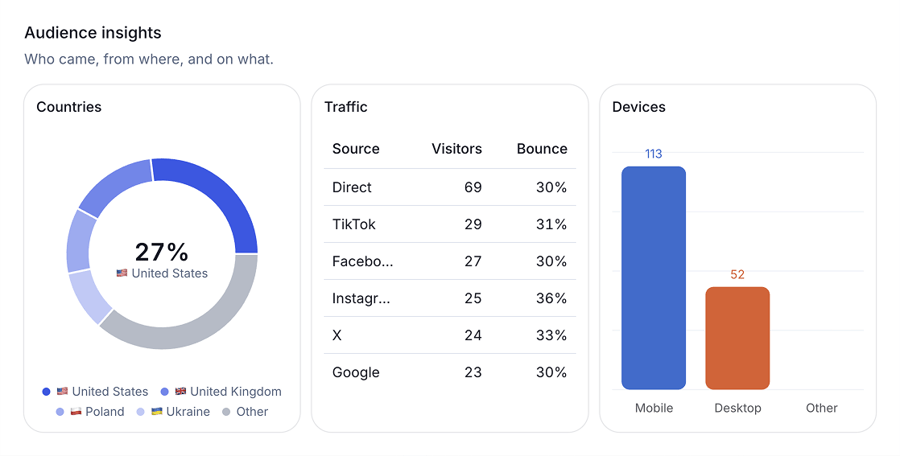
1. Click rate by source: who taps, not who looks
Where it comes from. Your tool groups visits by referrer — the platform the tap came from — and counts taps on your links inside those visits. Click rate is clicks divided by visits, per platform. Some tools show only a total click count; the per-source split is where the tools differ most.
What to change when it's bad. A low click rate means a mismatch: the video promised a recipe, the page leads with a course. When one platform's click rate is under half of your best (compare your own platforms, not a benchmark), fix the page it lands on, not the posts: put what you posted there this week at the top.
2. Top links: what goes first
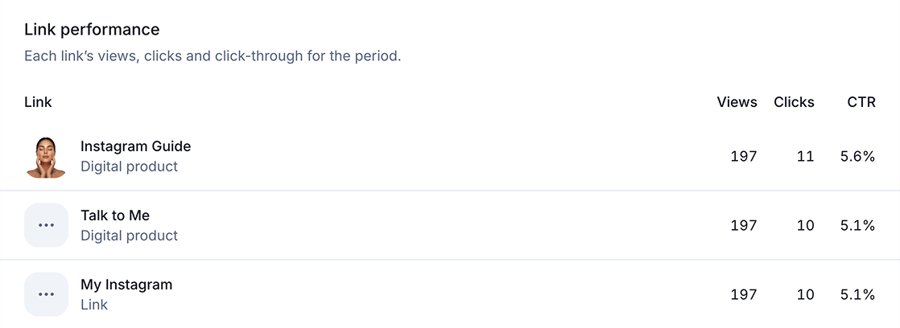
Where it comes from. Clicks per link over the date range — the one number almost every tool shows.
What to change when it's bad. The order. If slot four out-taps slot one, move it up. If the most-tapped link isn't the one you earn from, put the earning link directly under it. One reorder a week.
3. Sales by source: who pays
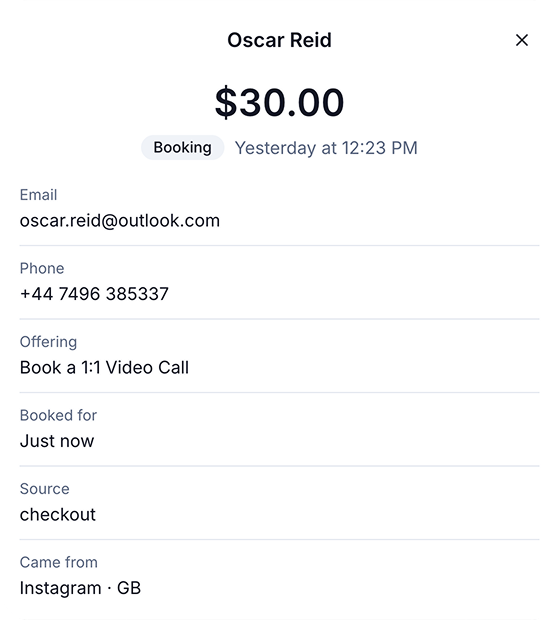
Where it comes from. If you sell on the page itself, visit and sale sit in the same system and can be attributed to a platform — check that your tool reports sales per source, not just a total. If the page links out to a shop, your bio-link tool sees the click and the shop sees the sale, and neither sees both; run one page per platform, each linking out with its own UTM tag (tags in the FAQ).
This is not number 1 again: click rate measures interest, sales measure money, and a platform can send people who tap everything and buy nothing. The table below shows it.
What to change when it's bad. Where you post. The platform with the most sales per visit gets next week's effort even with the fewest views. A platform with a high click rate and no sales gets a cheaper ask — an email signup or a free download — instead of the product.
A week of numbers, and the decision they force
Illustrative figures, not data — the shape is what matters. Seven days, three platforms, a page selling one digital product.
| Source | Visits | Clicks | Click rate | Sales | Sales per 1,000 visits |
|---|---|---|---|---|---|
| TikTok | 2,860 | 400 | 14% | 3 | 1.0 |
| 1,240 | 310 | 25% | 4 | 3.2 | |
| YouTube | 390 | 172 | 44% | 9 | 23 |
Views say TikTok. Sales say YouTube: 390 visitors bought more than 2,860 did. The week's changes:
- YouTube: nothing on the page. Post the next video there first and keep the description link on the product.
- TikTok: 14% is under half of YouTube's 44%: its viewers land on a page built for someone else. Put a link at the top that matches the TikTok posts and recheck in seven days. (Platform specifics are in the TikTok bio and link guides.)
- Instagram: fine. Leave it alone.
How to track your link-in-bio clicks in ten minutes
- Set the range to the last 7 days — shorter, and one good post is the whole chart.
- Find the source or referrer breakdown. Note visits and clicks per platform; work out the click rate if the tool doesn't.
- Open the per-link view and note the top three links.
- Find sales by source: in the tool if you sell on the page, in your shop's analytics by UTM tag if not.
- Write the three numbers down, make one change from the sections above, and leave the rest alone for seven days.
In InBio, this is Analytics in the dashboard.
Checked October 2026: InBio Free and Beginner ($4/month) show basic analytics: views, clicks, click-through rate, average time on page, a daily chart and the change against the previous period. Pro ($9/month) adds advanced analytics: clicks per link (including the links nobody tapped), traffic sources with bounce rate, and top countries and devices, so numbers 1 and 2 need Pro. Business ($29/month) adds store numbers (revenue, sales, bookings and conversion), and each order records the platform the buyer first arrived from.
This week's change is whichever your worst number points at: reorder, rebuild one platform's landing, or move your posting time to the platform that sends the buyers. If you don't have a page that reports these yet, create your InBio page and pick Pro for the per-link and per-source numbers, or read what InBio is and pricing first.
This guide is part of our link in bio basics series: what a link in bio is, how the tools compare, and what the numbers mean.